ggthemer
data("iris")
palette <- c(
  "flat", "flat dark", "dust", "light", "earth",
  "fresh", "chalk", "lilac", "carrot", "pale",
  "copper", "grape", "greyscale", "sky", "solarized", "grass", "sea", "camouflage"
)

p_list <- list()
for (i in 1:18) {
  themr <- ggthemr(palette[i], set_theme = FALSE)
  iris %>%
    ggplot(aes(x = Sepal.Length, y = Sepal.Width, color = Species)) +
    geom_point() +
    get_ggthemr_color(palette = palette[i], return_type = "color") +
    themr$theme +
    theme(legend.position = "none") -> p_list[[i]]
}

p <- p_list[[1]]
for (i in 2:18) {
  p <- p + p_list[[i]]
}
p + plot_layout(ncol = 6)
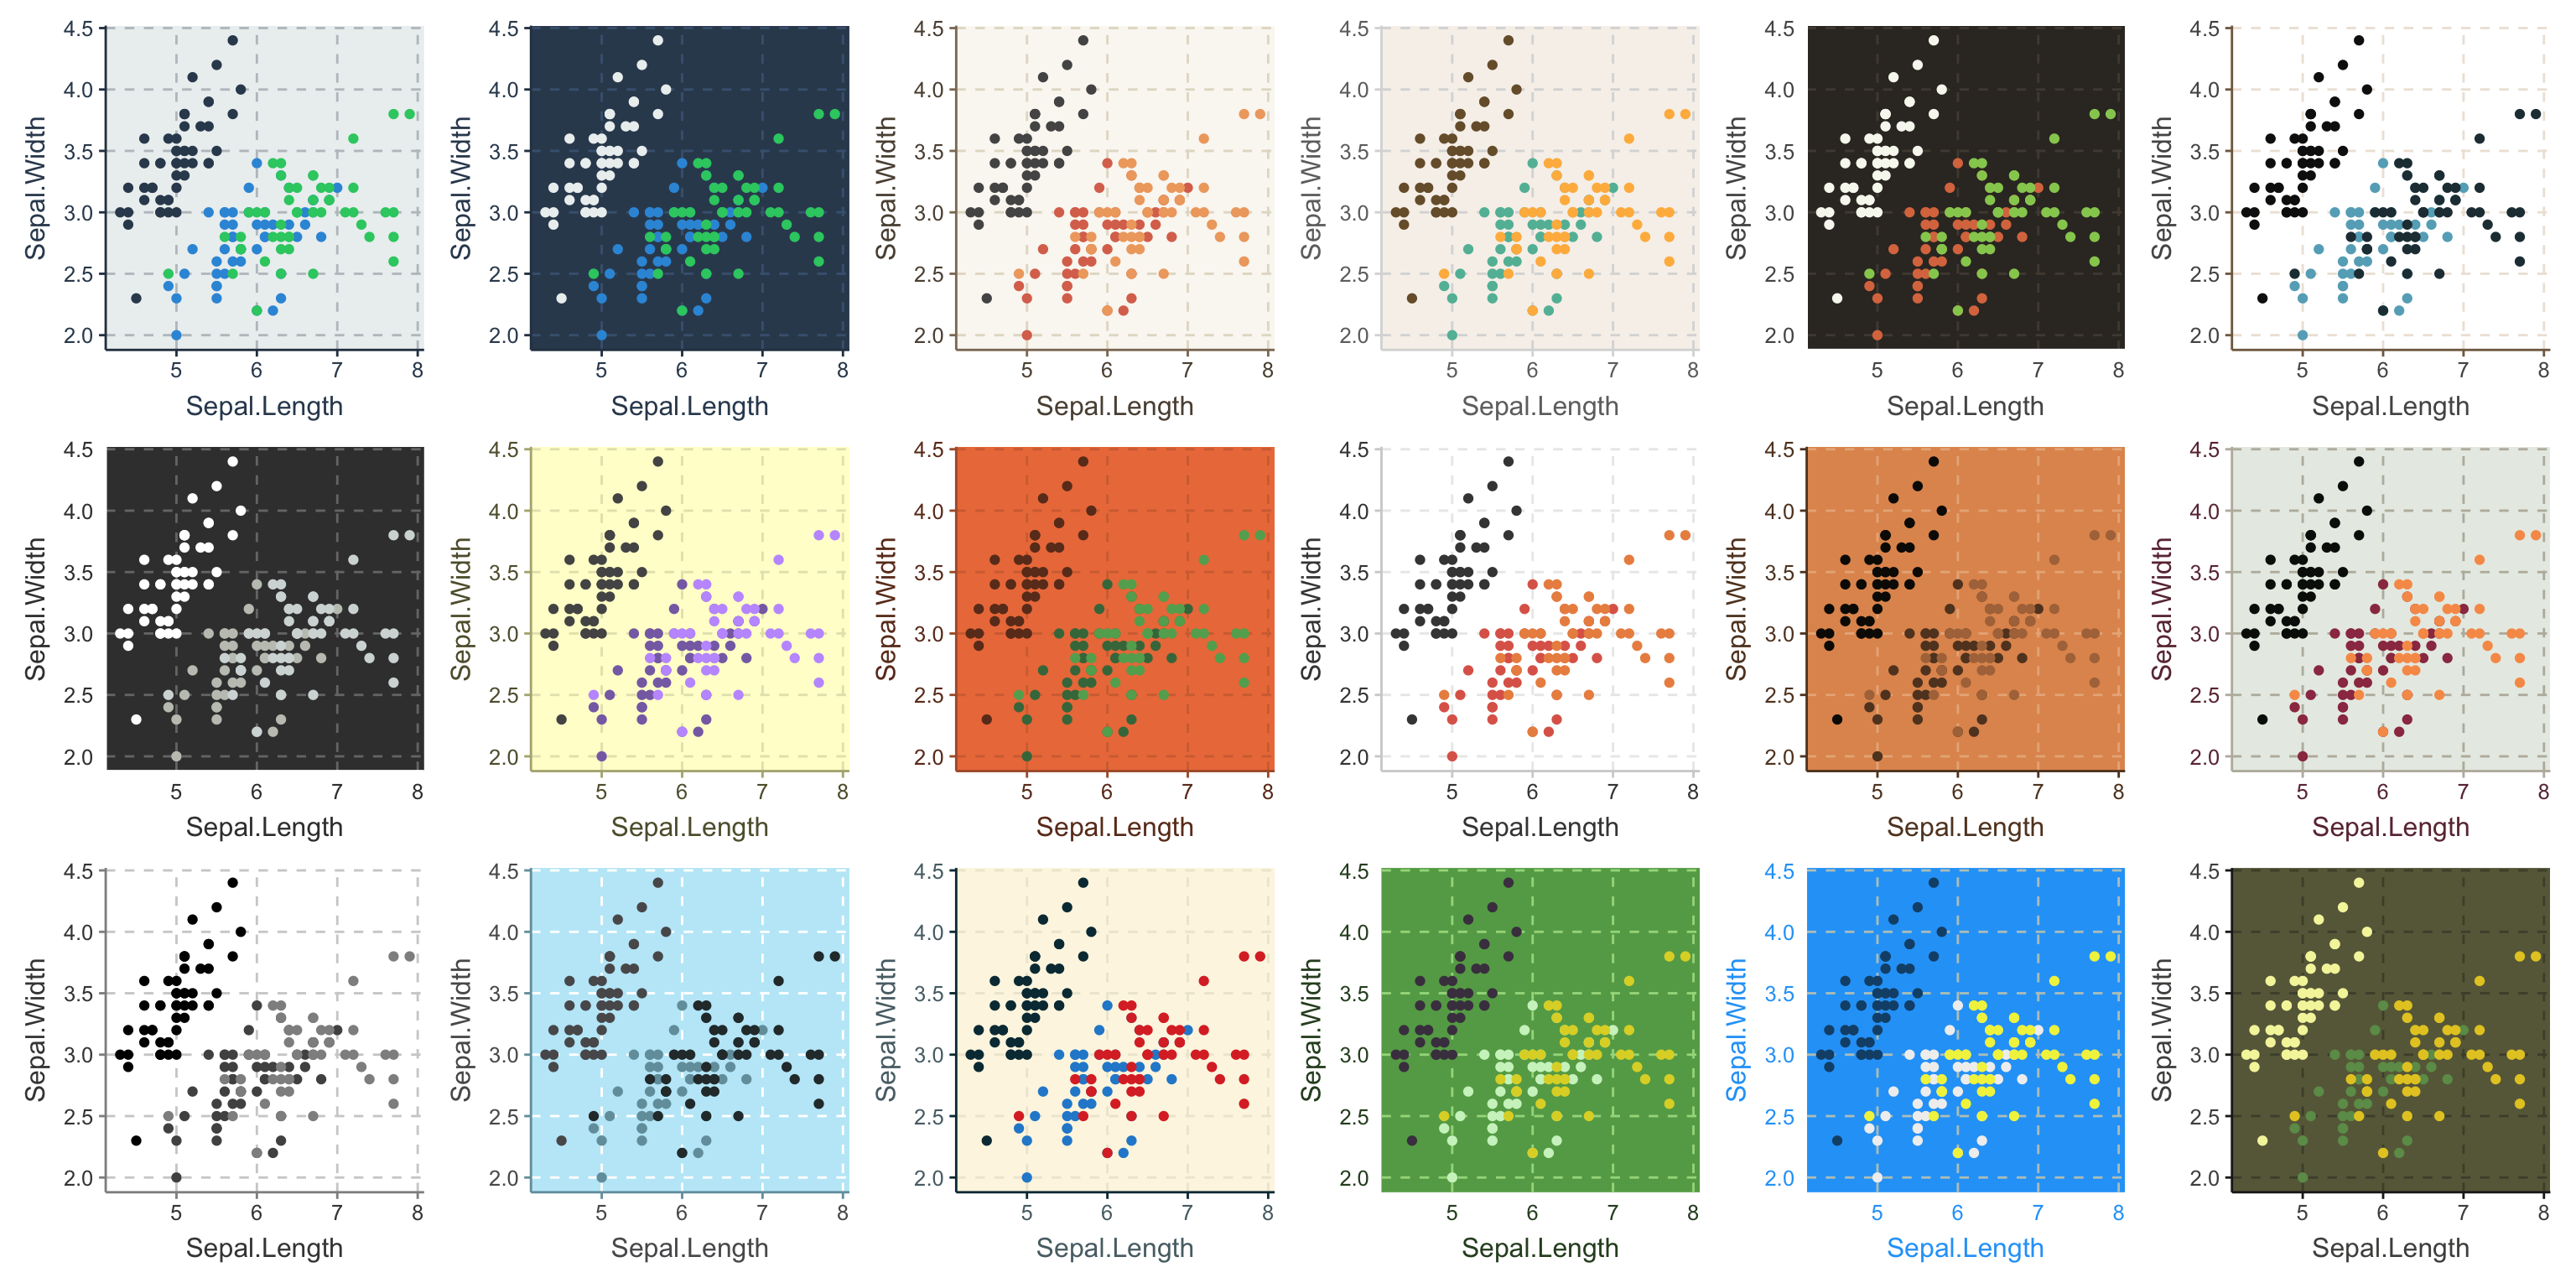
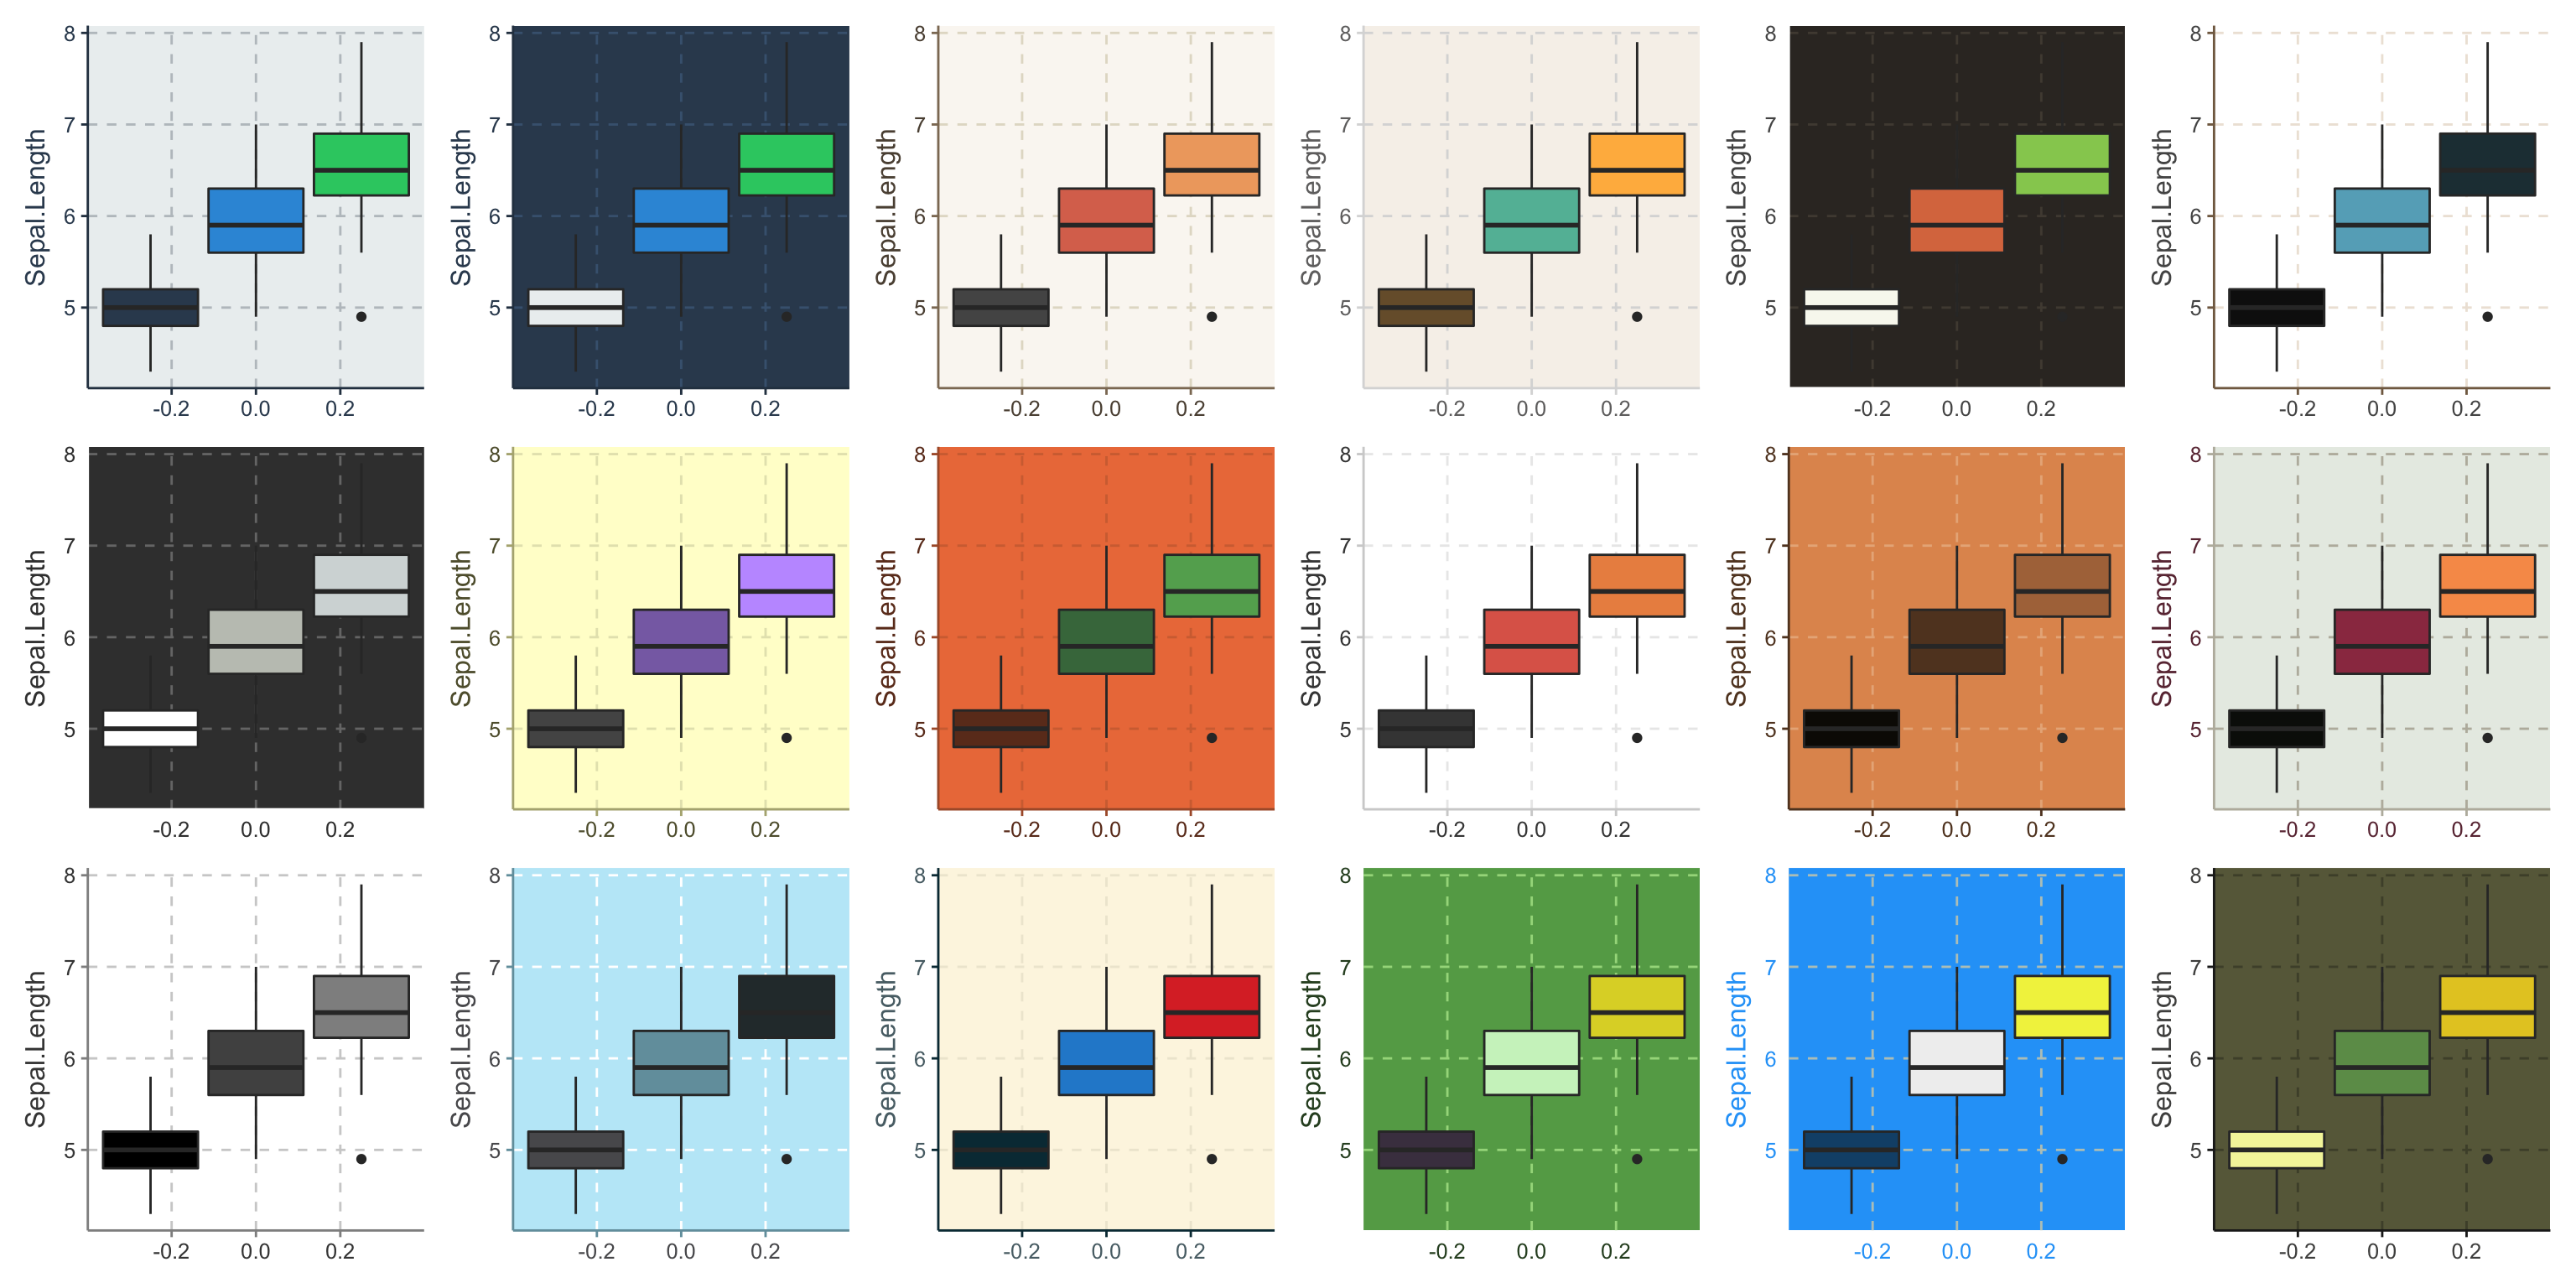
data("iris")
p_list <- list()
for (i in 1:18) {
  themr <- ggthemr(palette[i], set_theme = FALSE)
  iris %>%
    ggplot(aes(y = Sepal.Length, fill = Species)) +
    get_ggthemr_color(palette = palette[i], return_type = "fill") +
    geom_boxplot() +
    themr$theme +
    theme(legend.position = "none") -> p_list[[i]]
}

p <- p_list[[1]]
for (i in 2:18) {
  p <- p + p_list[[i]]
}
p + plot_layout(ncol = 6)
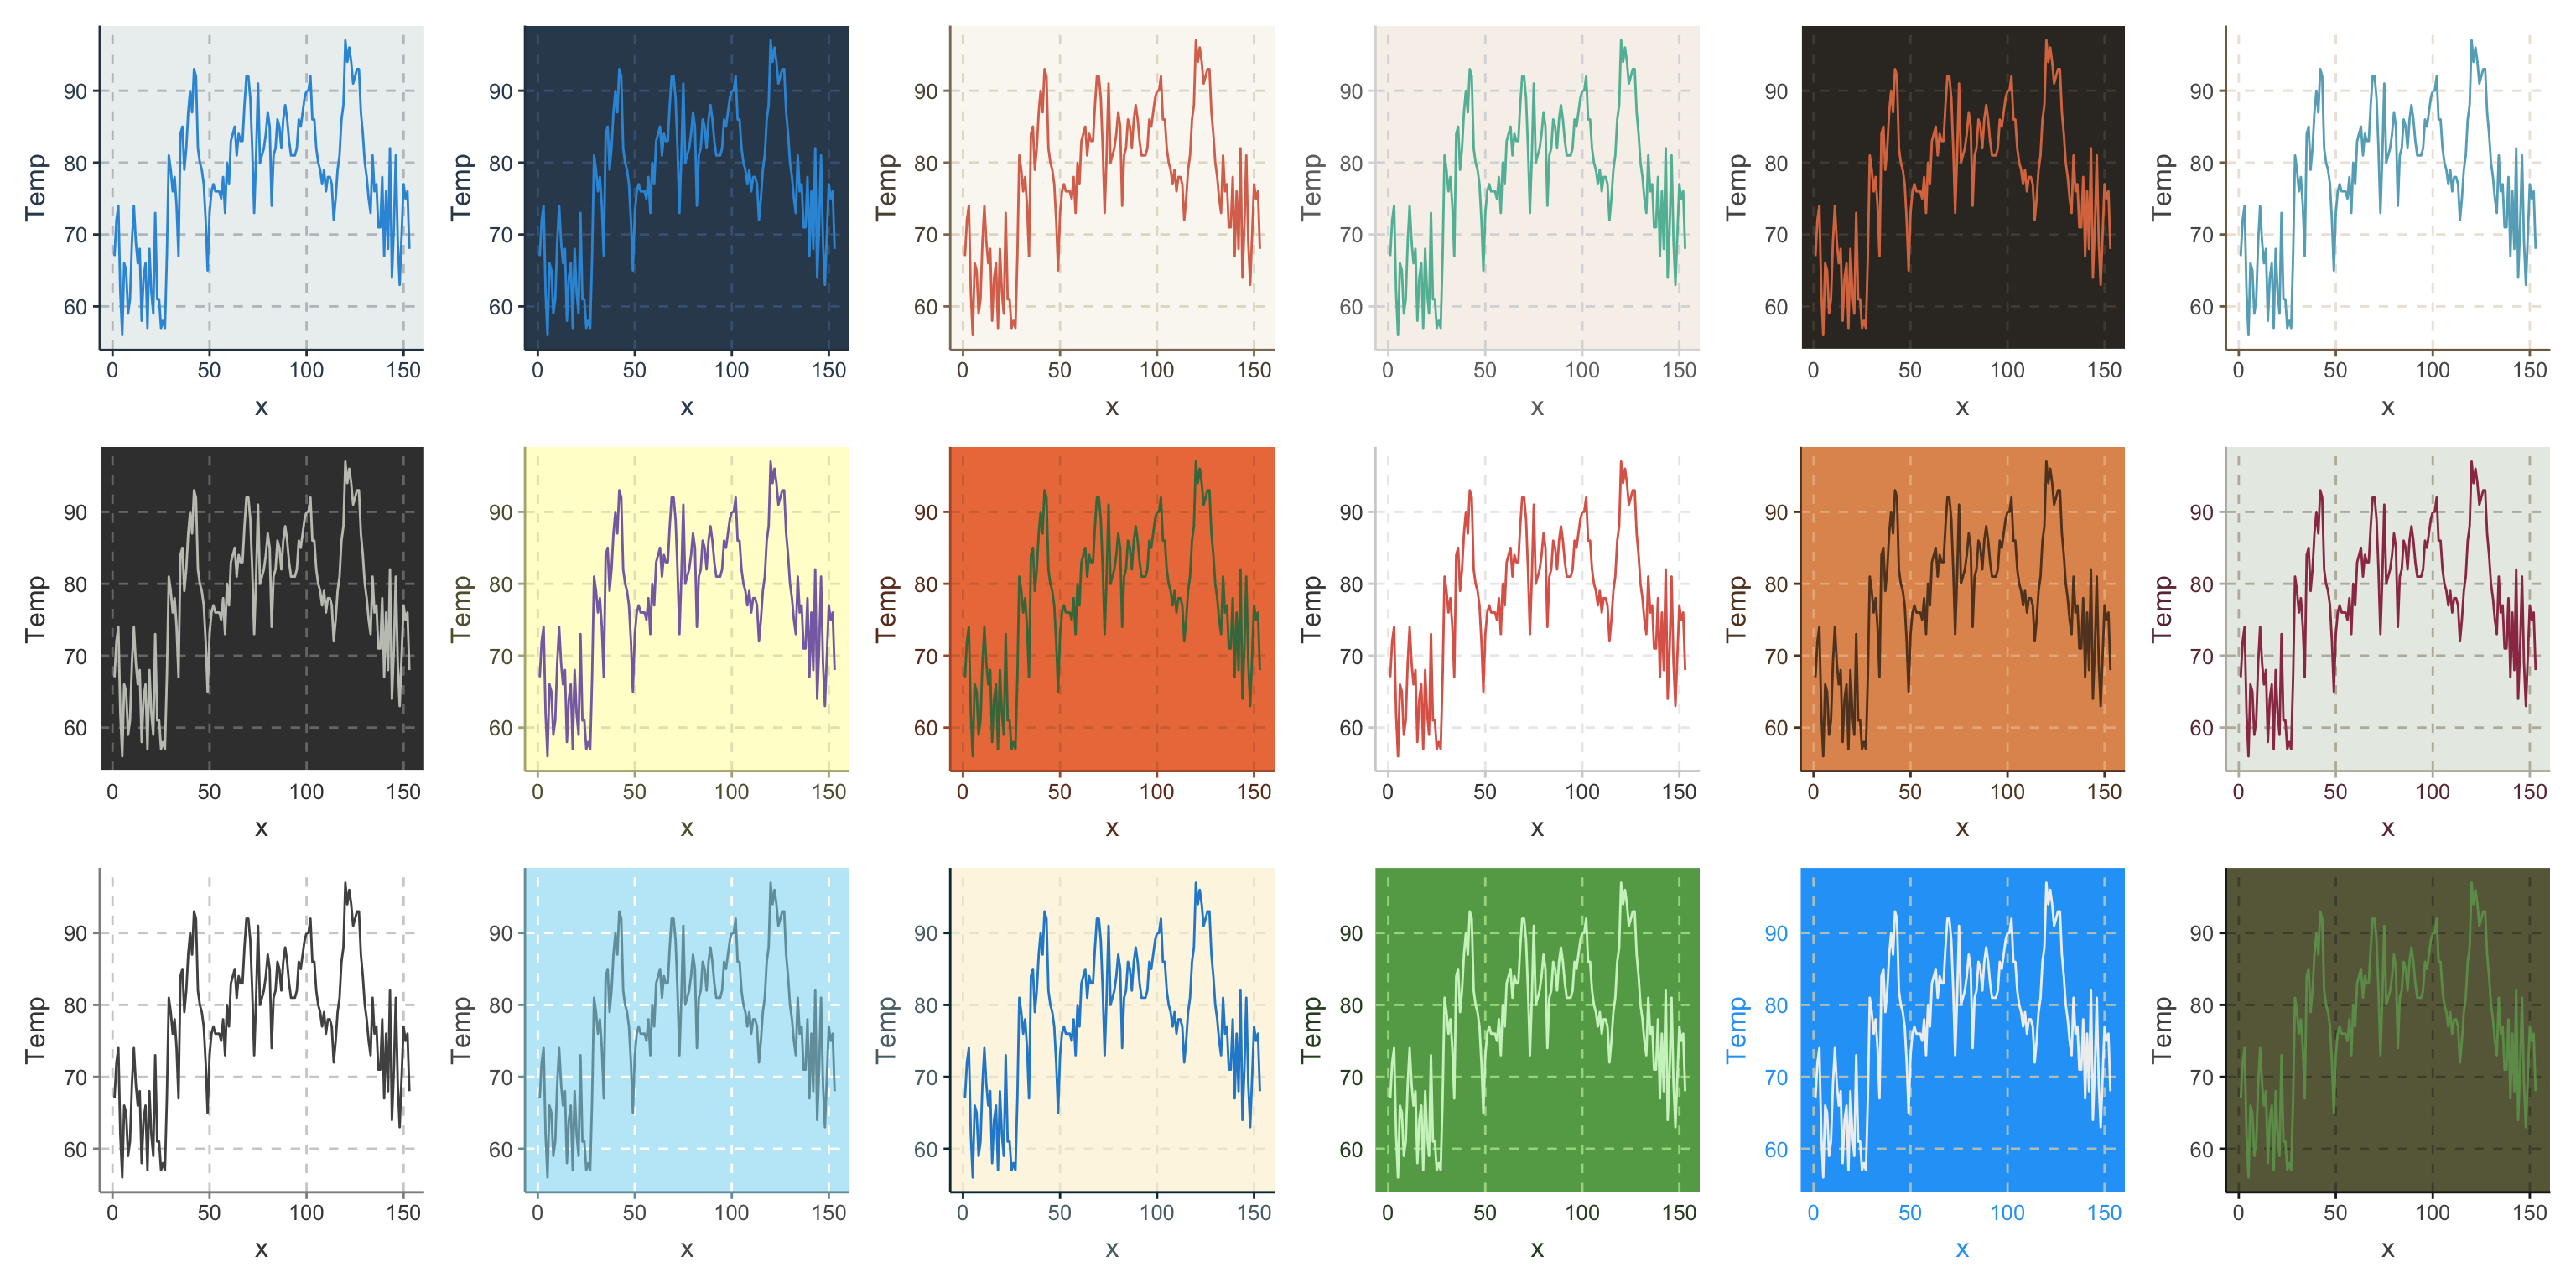
data("airquality")
p_list <- list()
for (i in 1:18) {
  themr <- ggthemr(palette[i], set_theme = FALSE)
  color_ <- get_ggthemr_color(palette = palette[i], return_type = "values")[2]
  airquality %>%
    mutate(x = 1:n()) %>%
    ggplot(aes(x = x, y = Temp, color = Temp)) +
    geom_line() +
    scale_color_gradient(low = color_, high = color_) +
    themr$theme +
    theme(legend.position = "none") -> p_list[[i]]
}

p <- p_list[[1]]
for (i in 2:18) {
  p <- p + p_list[[i]]
}
p + plot_layout(ncol = 6)
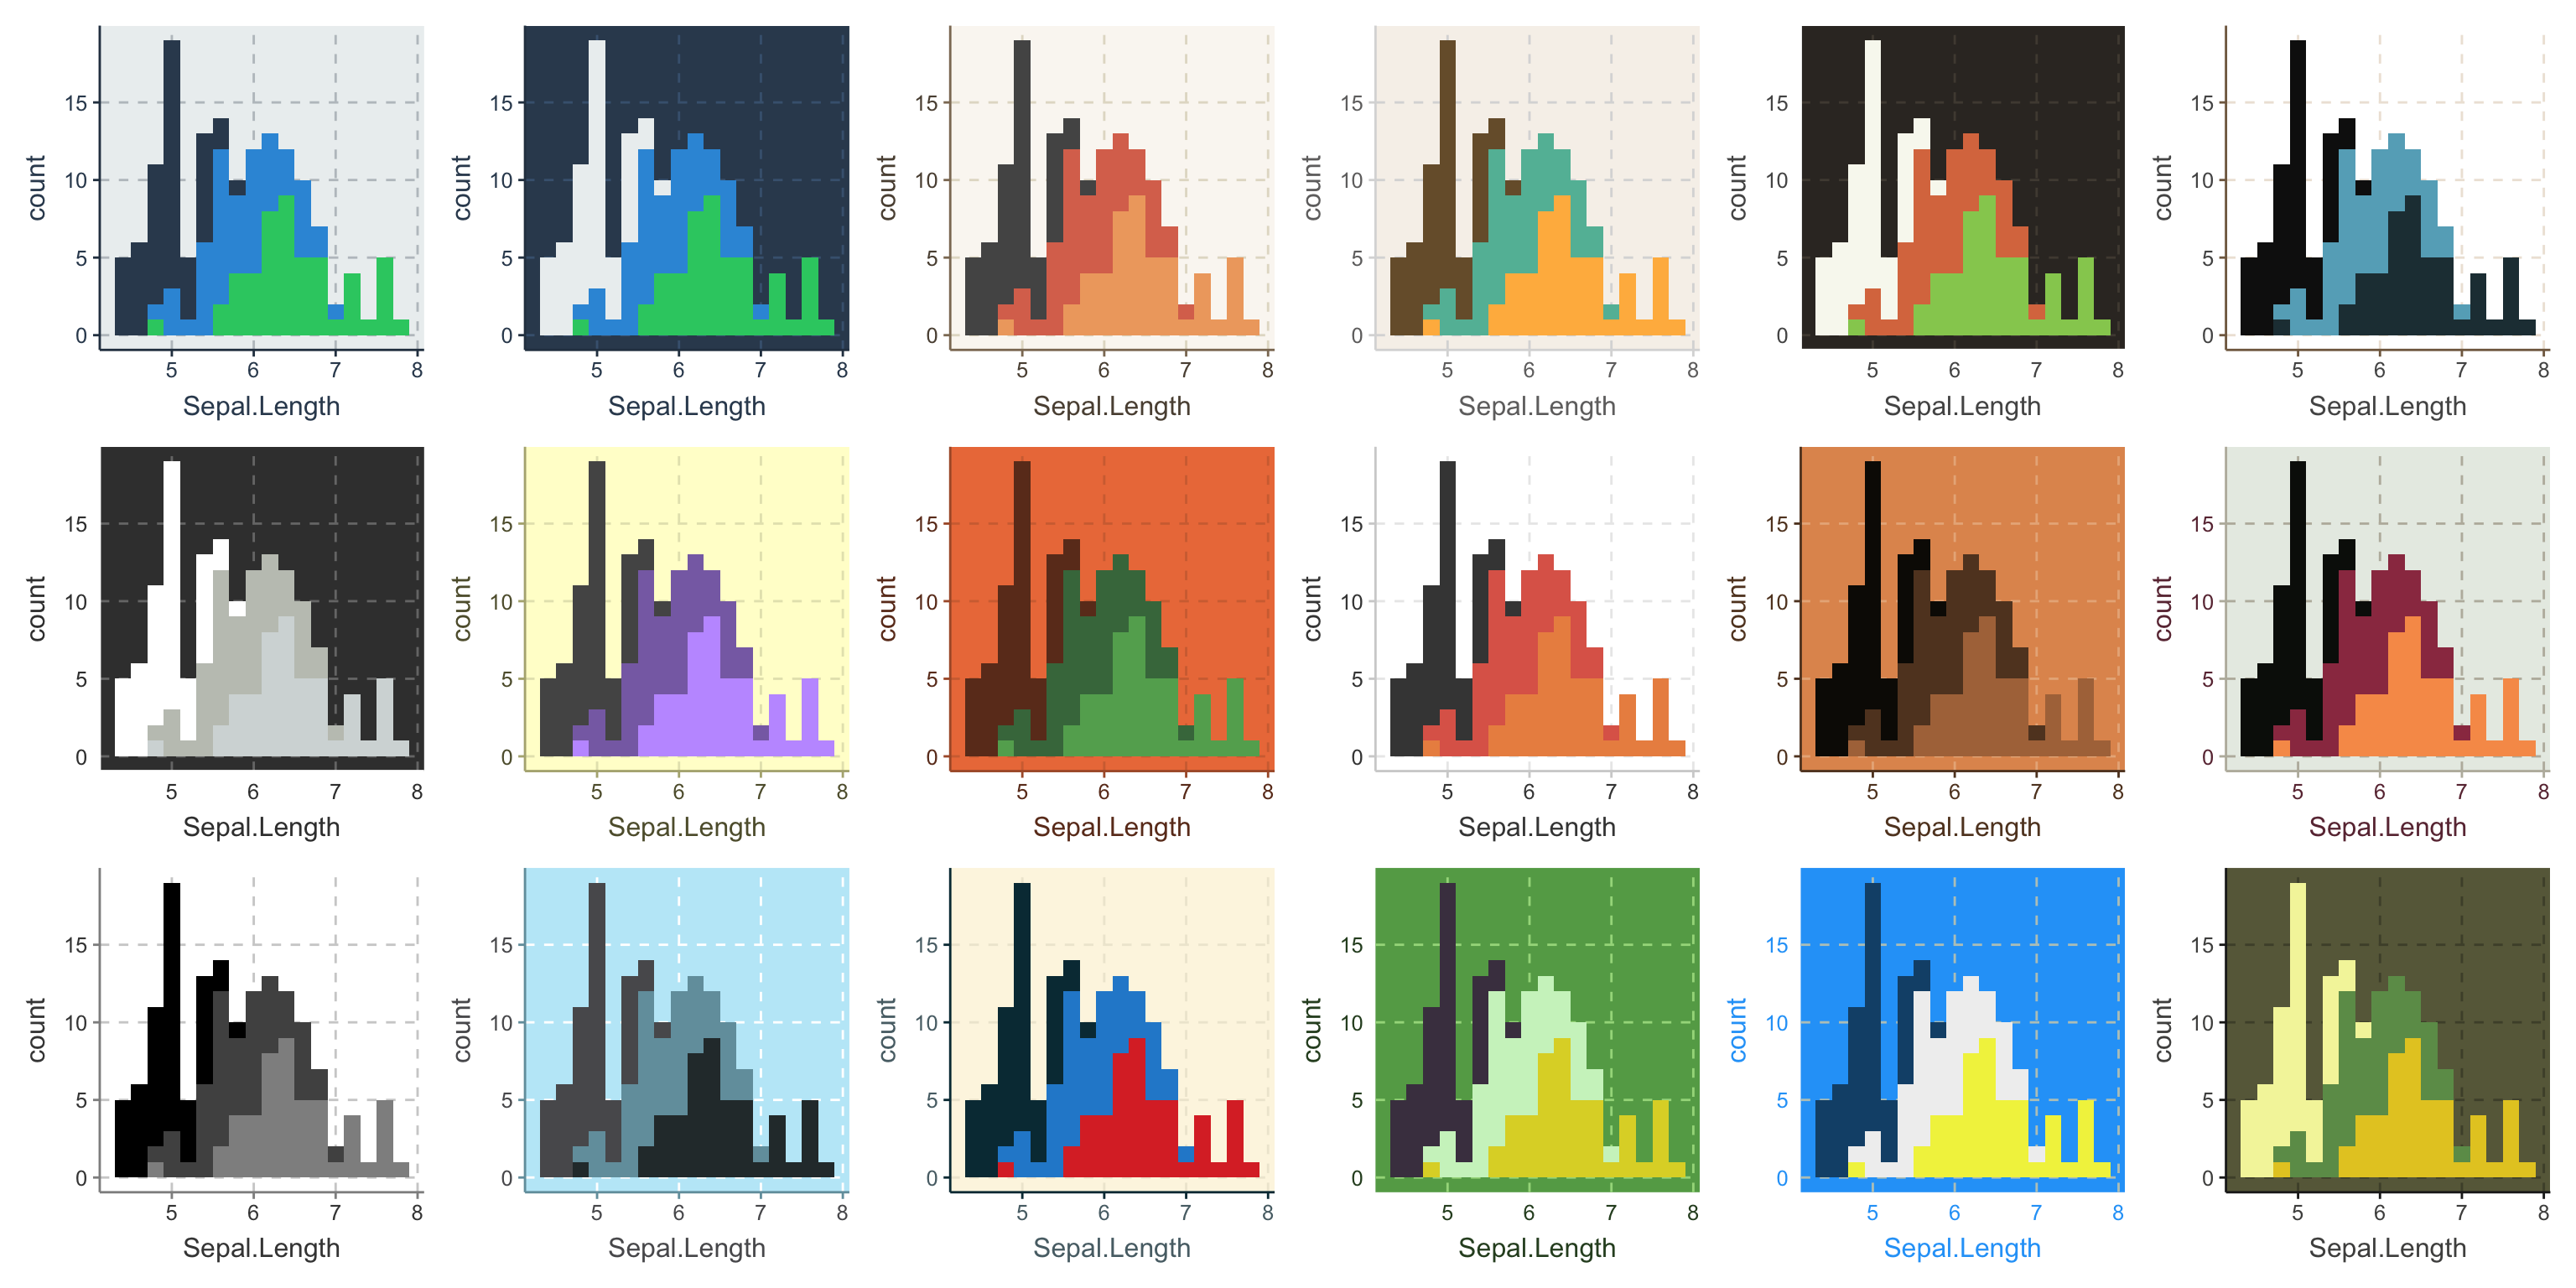
data("iris")
p_list <- list()
for (i in 1:18) {
  themr <- ggthemr(palette[i], set_theme = FALSE)
  iris %>%
    ggplot(aes(Sepal.Length, fill = Species)) +
    geom_histogram(binwidth = 0.2) +
    get_ggthemr_color(palette = palette[i], return_type = "fill") +
    themr$theme +
    theme(legend.position = "none") -> p_list[[i]]
}

p <- p_list[[1]]
for (i in 2:18) {
  p <- p + p_list[[i]]
}
p + plot_layout(ncol = 6)